Analytics
Every reader leaves a trail. Documentation analytics turns that trail into a roadmap: what people read, where they get stuck, and what they ask for in their own words.
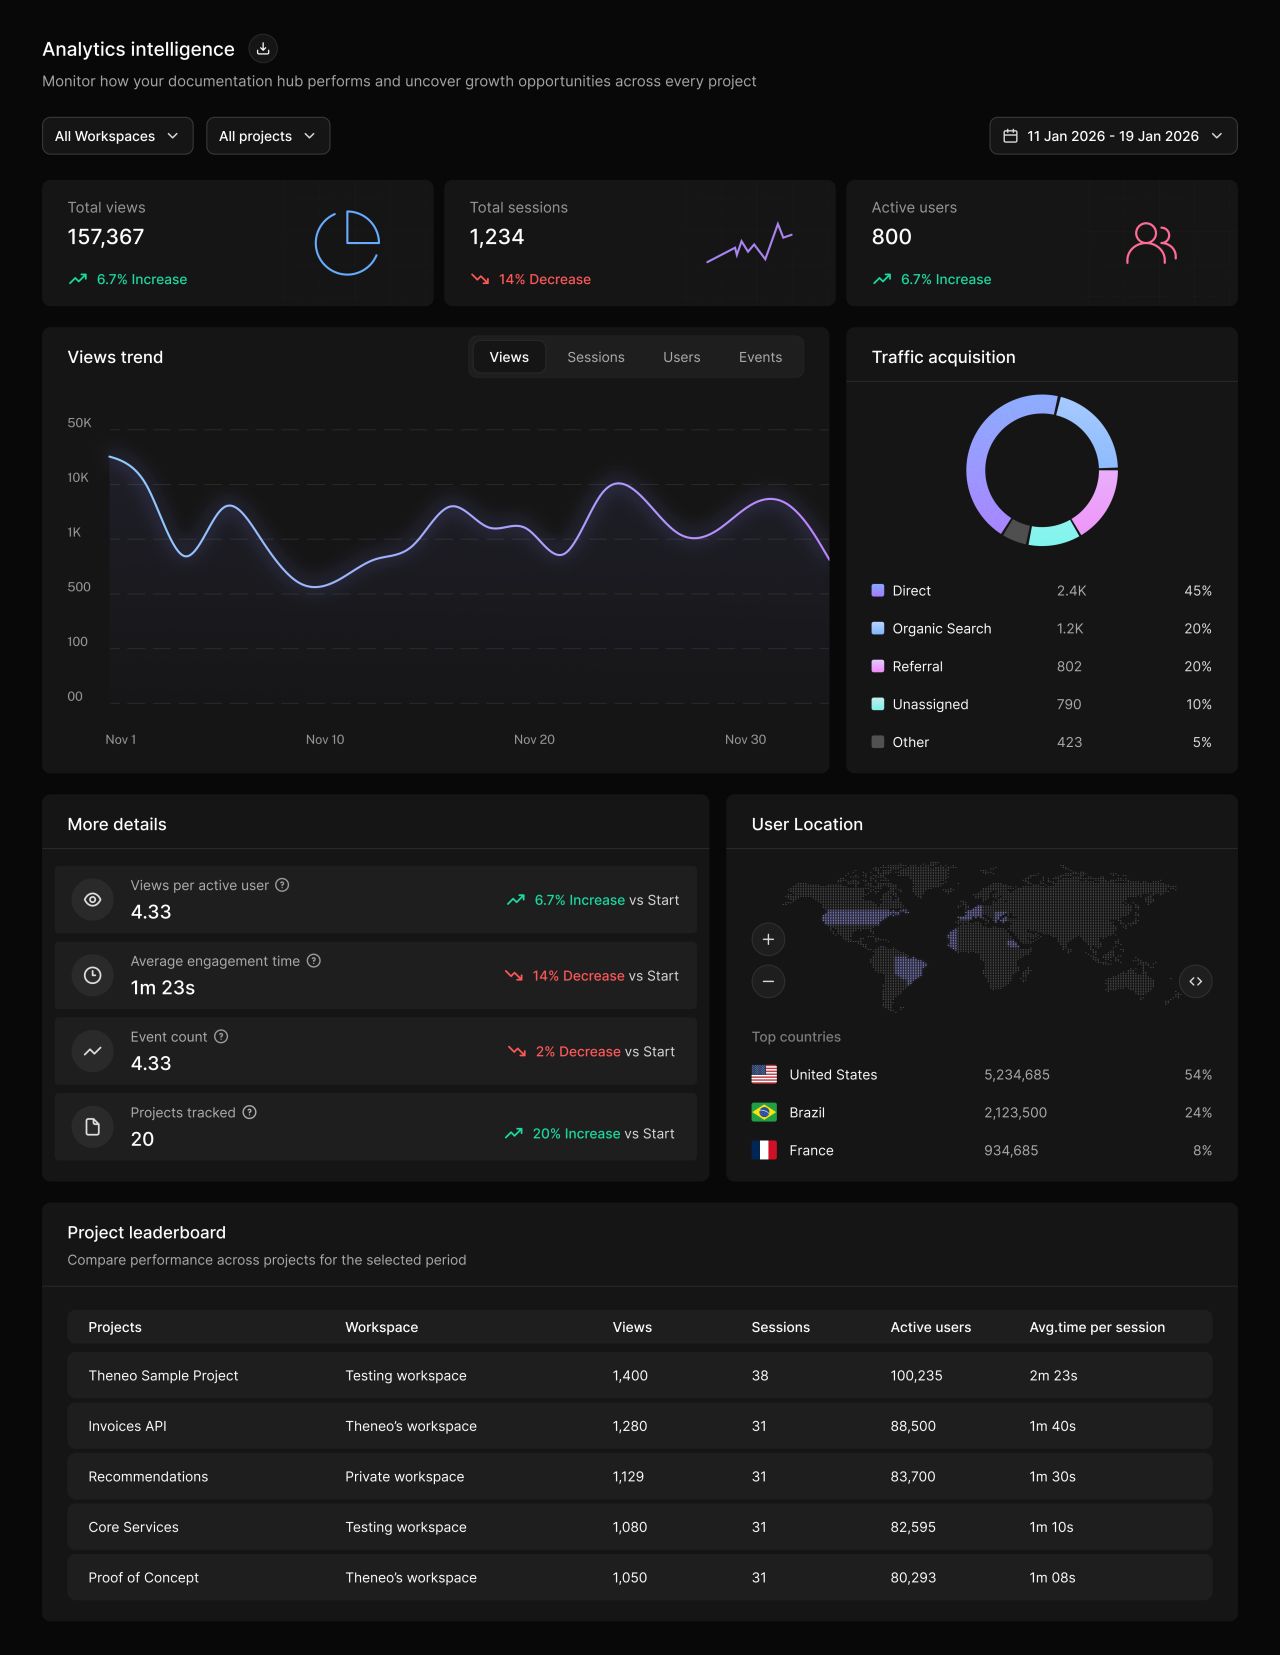
Where to find your analytics
Your main analytics dashboard lives at app.theneo.io/analytics. It rolls every project in your workspace into one view, so you can see the whole picture at a glance and filter by workspace, project, and date range.
Need a single project? Open it and select the Analytics tab. You get the same metrics, scoped to that one project.
Analytics turn on automatically the moment you publish, with no setup required. You can switch them off anytime in Project Settings → Features.
What the dashboard shows
Headline metrics
Total views, sessions, and active users across every project, each with the change versus the previous period.
Views trend
A time series of traffic so you can spot spikes, dips, and seasonality at a glance.
Traffic acquisition
Where readers come from, split across direct, organic search, referral, and more.
Audience & geography
Views per active user, average engagement time, and your top countries on a world map.
The project leaderboard ranks every project side by side on views, sessions, active users, and average time per session, so you can see which docs perform best across the workspace.
Traffic and engagement
Theneo records a view every time a reader opens a page, and groups activity into sessions and unique users. Tracked over time, these numbers show your reach and how each update moves the needle.
Use the date filter to focus on any range, ideal for measuring the impact of a launch or a docs overhaul.
Section feedback
Readers rate any section helpful or not, leave comments, suggest improvements, and ask questions, right where they are reading.
That feedback is fuel for continuous improvement. Review the comments, spot patterns in what confuses people, and ship targeted, data-driven updates.
A single thumbs-down with a comment points you straight to the section that needs work, no guesswork required.
AI Search history
Every question readers run through Ask AI is logged verbatim. It is the most honest list of what your docs are missing, written by the people who needed the answer.
- Identify common topics and questions
- Spot gaps where readers struggle to find information
- Improve content by adding what is missing or unclear
Want the deeper view? AI analytics breaks down Ask AI usage, trends, and answer gaps in detail, with per-question and per-page views. See the AI Analytics section under AI in Theneo.
Custom analytics
Connect Google Analytics (GA) or Google Tag Manager (GTM) to track interactions in your own tools.
Custom Analytics is available on Business and Growth tiers.
1
Open Branding settings
Log in and click Branding in the main navigation.
2
Open the Analytics tab
In the Branding submenu, click Analytics.
3
Add your Google Analytics tag ID
Find the Google tag ID field, click the pencil icon, and enter your GA ID (usually starts with "G-").
4
Add your Google Tag Manager ID
Find the Google tag manager field, click the pencil icon, and enter your GTM ID (usually starts with "GTM-" or "UA-").
5
Save
Save your changes.
6
Other analytics services
Using another provider? Open Custom CSS & JS from the Branding submenu and add your own tracking scripts.
Verify your setup: after adding GA or GTM IDs, check your GA/GTM dashboard to confirm it is receiving data from Theneo.
Best practices
- Monitor regularly: track visitor trends and feedback so nothing slips by.
- Identify weak spots: use AI Search history and low-performing pages as your signals.
- Act on feedback: respond to comments and rewrite the sections that confuse people.
- Compare over time: use date filtering to measure whether your changes worked.


On this page
- Analytics